Average Order Volume (AOV): Definition, Calculation & More
The eCommerce world is full of acronyms, definitions, KPIs, and important metrics. Unlike many other industries, though, they aren't just jargon or rebrands of common concepts; they're concepts themselves and essential to understanding business performance.
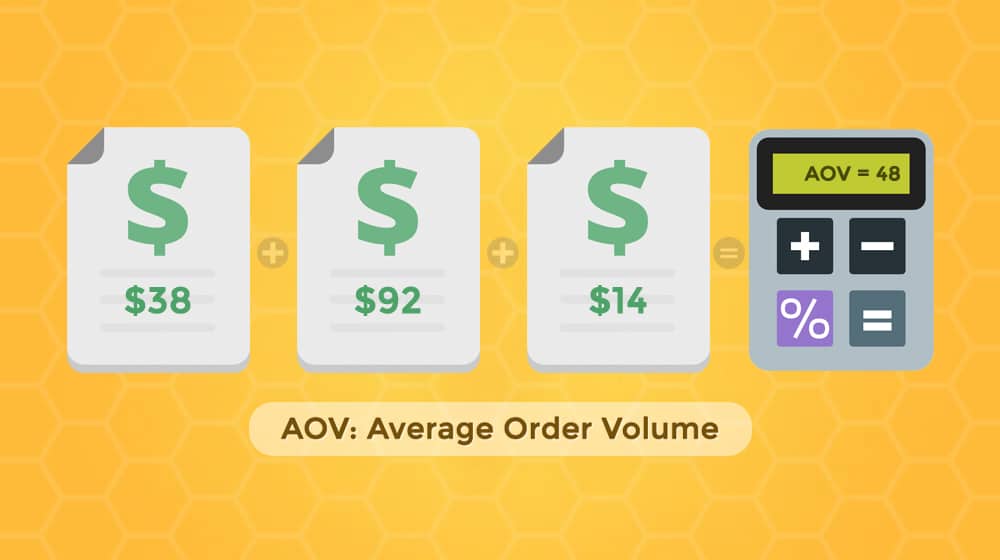
One such metric you'll see everywhere is AOV. AOV, or Average Order Volume (or Value, as most people refer to it), is a measurement of the average value of orders across your business over a given time.
Why do you want to calculate this, what do you need to monitor, and what can you do to optimize it?
Read on to find out!
 30 Second Summary
You need to calculate your Average Order Value (AOV) by dividing your total revenue by the number of sales in a specific time period. You can use AOV to track business growth, compare marketing campaigns and spot buying patterns. While there's no "perfect" AOV since it varies by industry, you can improve yours with several methods. You can set free shipping thresholds, add upsells and cross-sells to purchases, create urgency with limited-time deals, start a loyalty program or carefully raise your prices. Remember that a lower AOV with high sales volume can be just as profitable as a higher AOV with fewer sales.
What is the Definition of Average Order Volume?
Pretty simple. Right?
It's a time-based metric. That means you need to define a time with a start and an end date and can then calculate the average order value for orders within that time.
The AOV metric is helpful for cases where you want to predict revenue streams and manage budgets; you know what the average user is likely to spend, you can guess at your average number of sales, and can thus predict with relative accuracy what your revenue stream will be and what money you have to spend.
How Do You Calculate Average Order Volume?
Calculating AOV is very simple.
Before you start, check with your payment processor to see if they display AOV metrics in their reporting. If not, you can consider using a third-party integration with a tool like Baremetrics to pull in your sales data and calculate your AOV (along with many, many others).
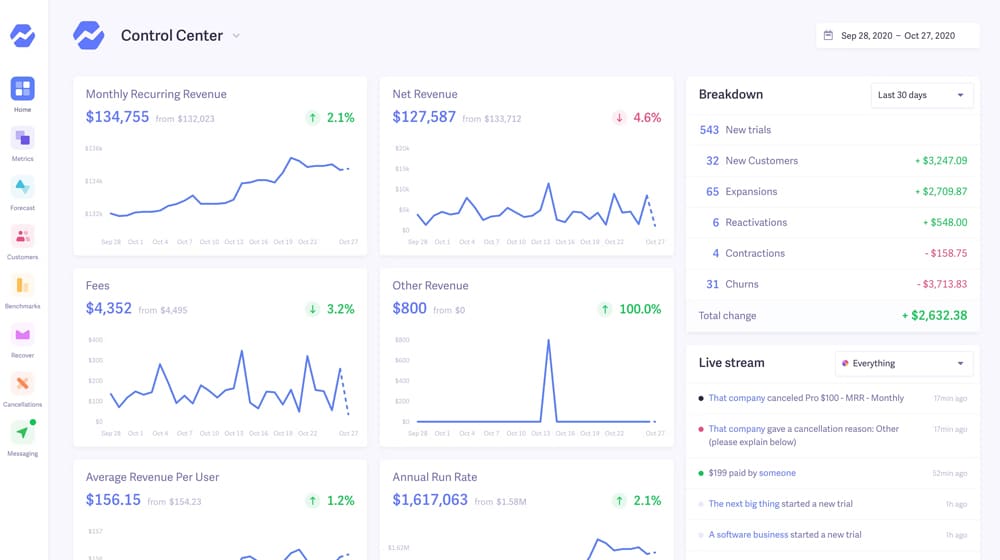
To calculate your AOV manually, first, you pick a date range. Maybe it's today, this week, or perhaps this month, a quarter, or a year. Anything longer than a year is typically not very useful. Often, anything shorter than a week is equally useless, except as a novelty. You can maybe use it to determine what days of the week you get the best sales, but that's about it.
Once you have your date range, you need two pieces of data.
- The first is the total number of orders made in that time. Usually, you'll want to exclude orders that were refunded or charged back or otherwise didn't complete, as these aren't relevant to your actual business metrics and shouldn't be planned around.
- The second piece of data is the total revenue your business brought in during that chosen timeframe.
The equation is this:
AOV = Revenue / Number of Sales
So let's put this into practice. Say you've picked the first quarter of 2022. During those three months, you pulled in $35,000 in revenue. You checked your records and had a total of 1,000 sales during that quarter. Your equation would be:
AOV = $35,000 / 1,000 = $35
So, the average customer spent $35 on your products during the first quarter.
This average doesn't mean every customer spent $35 at your online store; some might have paid $5 or $20, and others might have spent $50 or $500. All you're doing is calculating the average. Using that average, you know that if you have 1,000 sales in the second quarter, you can expect around $35,000 in revenue again; if you have 2,000 sales, you can expect $70,000 in revenue.
These numbers are helpful for rough estimates and are only sometimes accurate. You could have doubled your sales because you ran a promotion for buy-one-get-one, effectively cutting your price in half and keeping your AOV at $35. There are many factors to consider, but this is the core of AOV calculations.
How Can You Use The Average Order Volume Metric?
AOV is a benchmarking metric. It lets you compare one period to another and study contextual changes to see what might be improving or hindering your AOV.
For example, if you compare Q1 to Q2 and find that in Q2, you had better AOVs, you might look into why. There are many possible reasons! Demand went up, a competitor went under, or your marketing became more effective. Perhaps it's a holiday, and people are spending more on Christmas gifts, or you're listing a more affordable product than competitors who raised their product pricing.
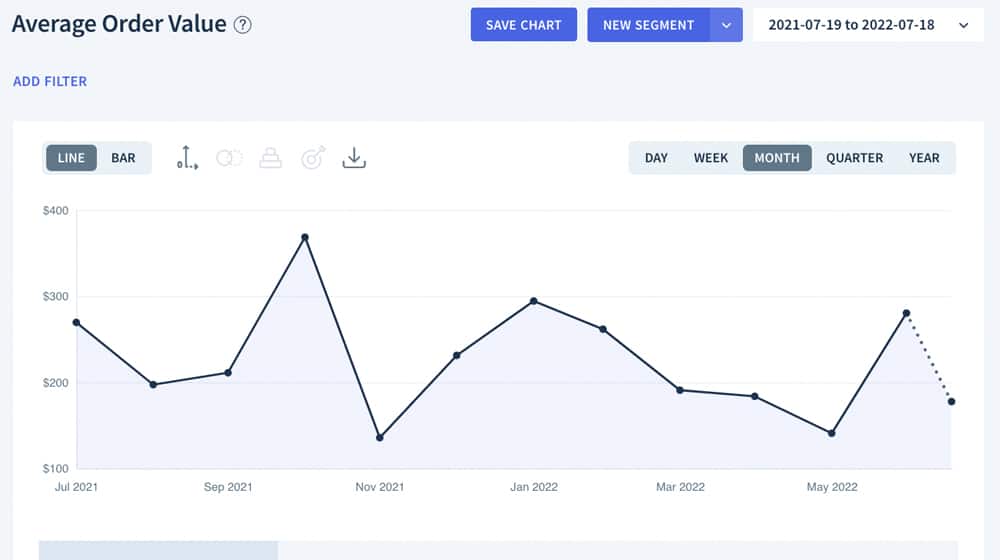
Conversely, you may see a drop in AOV. This drop could be anything from one whale customer finding a new supplier to an ongoing promotion leading to lower revenue despite higher sales or just the ebb and flow of seasonal purchasing habits.
Some ways you can use AOV as a helpful metric include:
- Compare it to when you start new ad campaigns. Does the new campaign work to increase average order volume, or does it benefit you in other ways instead?
- Look for timing patterns. Do you have a better AOV when selling to people in the fall or spring? Do they buy more towards the start of the month or the end of the month?
- Benchmark yourself and track your AOV over time to determine how well you're growing, other things being equal.
AOV is not a hugely valuable predictive tool nor necessarily super accurate. It is, however, helpful in comparing apples to apples over time. You can calculate AOV every week and chart it, with data points correlating to changes in marketing or promotions, and see how they perform.
What's a Good Average Order Volume?
This one is a tricky question.
An upward trend is usually better because it means your customers spend more per purchase, but that isn't always the case. For example:
- A company that sells yachts will have an extremely high average order volume, blowing Amazon out of the water. But they're likely only going to make a couple of sales a year.
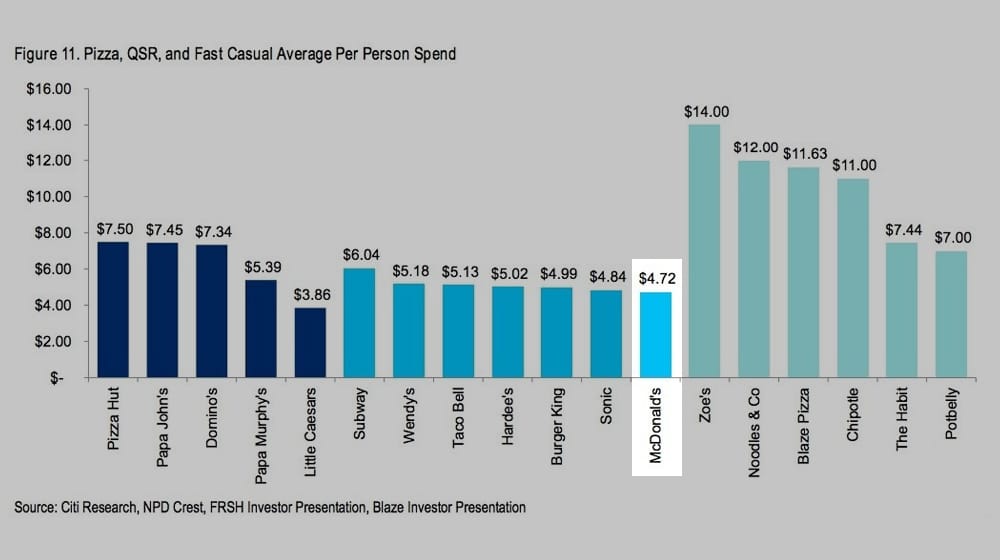
- Conversely, a company like McDonald's has an average order volume of around $4, but they earn billions of dollars in profit every year. Most people aren't going there to spend $100 on food; they're going there to pick up a $3 combo meal. McDonald's sells tens of millions of meals every day across their entire franchise.
This example is also a good illustration of another way you can use AOV. McDonald's can analyze the AOV for each location and identify areas where it might be able to invest more heavily in its existing restaurant or open a new one.
Here are a couple of additional examples of why there's no such thing as a "good" AOV:
- If your average order volume is impressive, but your gross profit and profit margins are abysmal, you might not be able to stay in business.
- If your average order volume is super low, you might have a large amount of repeat and loyal customers and, therefore, a high customer lifetime value (CLV).
- If your AOV is high, but your customer acquisition cost and customer retention are poor, you could be spending too much money on subscribers that you end up losing - even if your AOV is high or increasing in that first month.
This metric is only helpful if it's compared to another timeframe or used within the context of other metrics.
How Can You Increase AOV?
The good news is there are many things you can do to improve your average order volume. The bad news is it's only possible to say which options will work for you once you try them and see how they go. What choices do you have?
1. Use a free shipping threshold.
Remember years ago when Amazon offered free shipping on any order over a specific value? If their average order value was $25, and they decided to offer free shipping on any order over $30, people would quickly start adding more to their carts to reach that free shipping threshold.
Before long, their AOV might be closer to $28, $29, or $30, depending on how compelling the free shipping is.

It's easy to do this yourself. The hardest part is simply deciding what the order threshold should be. You can use split testing and audience analysis to determine this, but at a certain point, it merely requires experimentation.
If shipping needs to be more enticing, you can offer simple discounts on orders over a specific value.
Applying a 10% discount on carts over $50 is an excellent way to make people want to spend more than $50, even if their initial purchase was only $40, and they end up paying more anyway.
2. Implement upselling and cross-selling.
Upselling and cross-selling are very similar processes.
Upselling means giving a user an offer of a better version of what they're considering buying and convincing them to go for it. Maybe instead of a 45" TV, you persuade them to buy a 50" TV. You could convince them to upgrade from a small fry to a large fry in their happy meal. You could persuade them to upgrade from one blog post per week to two.
It's the same (or similar) product, but better in some way. It's more significant, and it's more frequent, it's higher quality, it's more powerful.
More importantly, the upsold item replaces the previous product in the buyer's cart in an upsell. An upsell increases the average order value by the difference between the lower-tier and higher-tier versions.
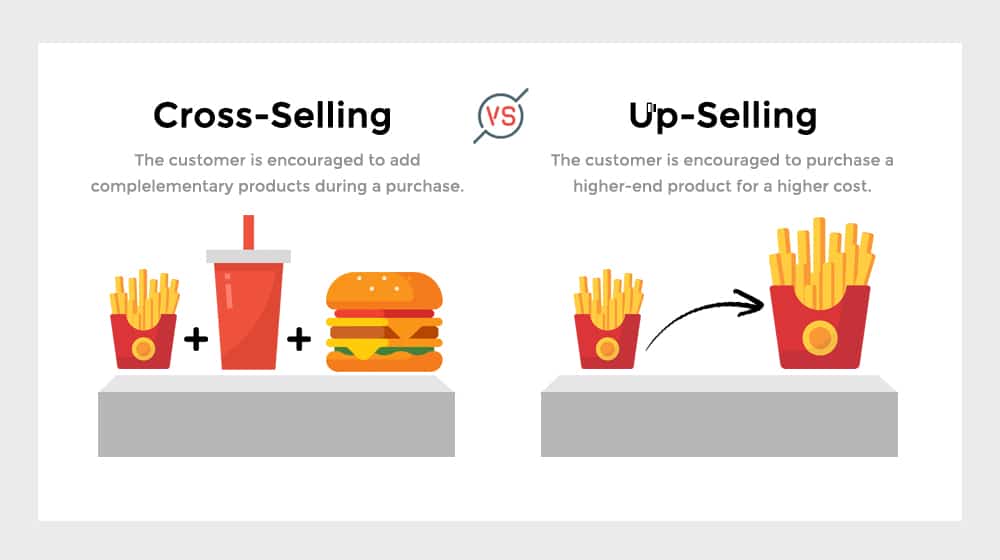
Conversely, a cross-sell is where you sell complementary items alongside the item the user buys.
You see this everywhere; McDonald's asks if you want to add a drink to your burger and fries to make it a combo meal.
Amazon has "Frequently bought together" lists that usually include related products, accessories, and add-ons. A user goes to buy a camera, and you recommend that they also get a case, a cleaning cloth, an SD card for storage, a few lenses, some cords to connect it to the computer, and a photo-manipulation program.
Both are ways to convince users to buy more than they would initially buy.
You can even add these upgrades and add-ons at a discount; the average order volume is lower than if the user had bought it all at retail prices but higher than if they didn't buy that extra product at all.
3. Weaponize the fear of missing out on a deal.
The Fear of Missing Out, or FOMO, is a powerful tool. By saying your items have a limited quantity, or they'll only be available for a short period of time, or they'll otherwise be gone before you know it, you incentivize the user to make the purchase when they otherwise might not.

This practice doesn't necessarily increase average order volume. It does if the user is going to buy a smaller package order, but you usually convince them with FOMO to purchase something they wouldn't have added to their cart. On the other hand, if you persuade a non-customer to become a new customer, it only increases your AOV if their order is more significant than your typical AOV.
4. Create a customer loyalty program.
A loyalty or referral program can be an excellent way to offer users intangible or non-monetary benefits when they make purchases. These marketing strategies encourage users to make orders from you, including larger orders and orders when you don't have sales or discounts running. Both of those can increase your AOV. Plus, you can encourage further sales by increasing the intangible rewards in a way that doesn't hurt your AOV the way offering discounts might.

One tricky aspect of this is referral programs. A referral program may decrease your average order value because the referred people might not be willing to jump into full-price carts and may prefer to buy something small to verify that they can trust you first.
5. Raise prices.
It might seem obvious, but raising prices will undoubtedly increase your AOV. It's a tricky business decision to make because you always run the risk of pricing out your audience. Some people won't want to buy after you raise prices; others will recognize that they were getting a great deal before, and the adjustment comes with the territory.
Consider examples like Netflix and Hulu, who have offered their services for low prices for years but periodically raised them. Sure, they lose a small percentage of their customer base, but their AOV and total revenue will increase.

These two companies are yet another great example of why AOV isn't everything. If you raise prices, your AOV increases, but if your order volume decreases to compensate, your overall revenue might not be enough to benefit from the change. This phenomenon is why so many price increases in business are just a dollar or two, to make it less noticeable.
Wrapping Up
While average order value is a powerful metric, it's a metric that is heavily reliant on your situation. Different industries, specialties, and other contextual elements of an eCommerce business will significantly impact your AOV.
Remembering that AOV doesn't need to be high to be "good" is also critical. Plenty of companies thrive off of low AOV and high-volume sales.
It's all about where your niche is and what kind of average volume your audience will support. Once you have that figured out, you'll be golden.


 30 Second Summary


Comments