How to Use Google Trends for Keyword Research and SEO
Google Trends is a fascinating tool. It's essentially a data and analytics spin-off of Google News, providing information on trending search topics, geographic breakdowns, search interest over time, and other data points that are either useful or just plain neat. Unlike many Google services, it's been around for a long time and hasn't changed much in all that time.
It's also a surprisingly powerful tool for marketers, especially if you're the kind of business that uses trending topics to piggyback off with your content creation or even newsjack trends to use for your digital marketing purposes.
Like the PPC keyword research tool (Google Keyword Planner), Google Trends pulls valuable insights straight from the Google search engine and it's a free tool. It doesn't get much better than that.
How can you make use of Google Trends in your own marketing? A lot of different ways, so let's dig in.
Can You Use Google Trends For Keyword Research?
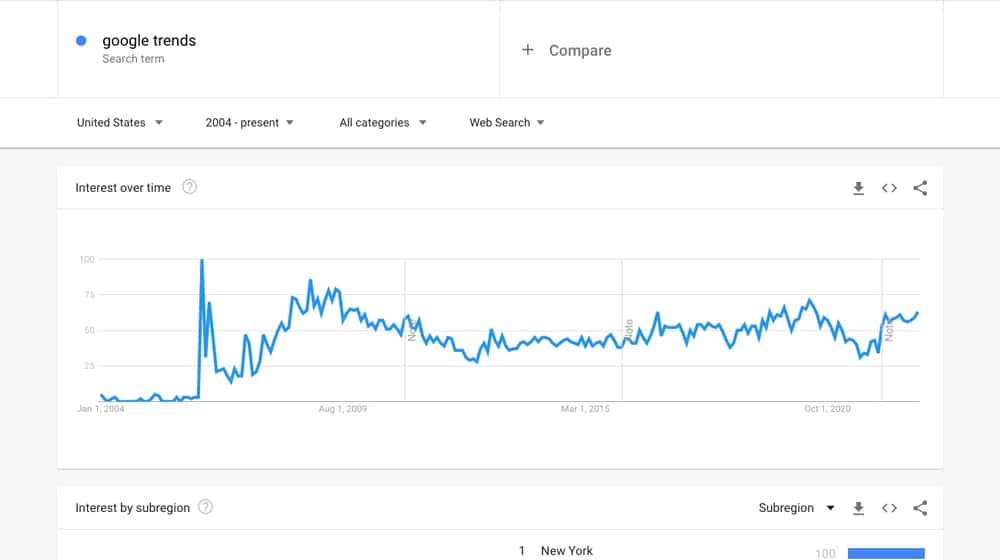
In particular, when you put a search term into a Google Trends search, you'll see search interest in that search term over time.
Note that this does not give you search volume numbers. The vertical scale is scored between 0-100, but it's adjusted for 0 to be zero search interest and 100 to be the peak search interest of all time. You can't use this to estimate absolute search numbers, just relative search numbers compared to the exact search in the past.
The critical part here is that you can see how the topic trends over time. By default, Google shows you the past year of search volume estimates for the topic. You can change that date range to any custom time range or one of Google's pre-set times, including "everything from 2004 to present."
Why is this important?
Well, you can use it to determine two things:
- Is the interest in the topic rising or falling over time on a long enough scale?
- Is interest rising or falling compared to the previous year?
This information helps you distinguish between a fad and a genuine trend, as well as between an evergreen topic, a topic that has a long and slow decline in interest, and a topic that is growing in relative popularity. This tool also pulls real-time data, so you can follow queries to see how interest grows or wanes over time.
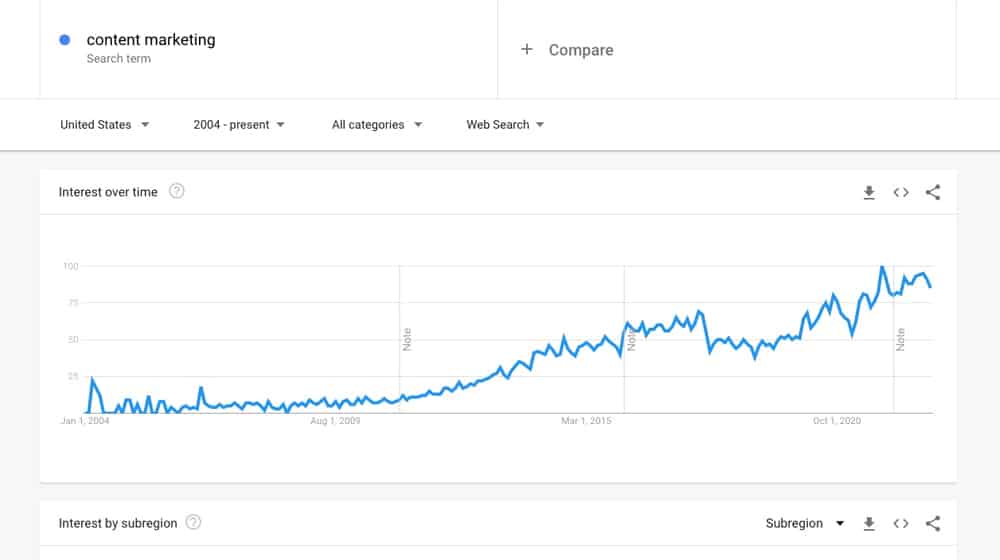
For example, if you put "content marketing" into the trend bar, you'll see a relatively flat line for the past year. It has ups and downs, but there's no clear trend upwards or downwards. But, if you expand the timeline to the past two years, you see a slow increase. If you expand it back to 2004, you see that, while it has some peaks and valleys, it's still trending upwards. In fact, as of this writing, the peak interest of all time was October 2021.
This data is helpful whenever you want to create pillar, 10x, or skyscraper content for a given topic. If you're going to produce an evergreen mega-guide, you want it to be about a topic that's growing in interest, not falling, right?
You don't want to invest all that time and resources into something that will eventually flatline.
There are many different ways you can plug a new keyword into Google and get related keywords.
All of their auto-complete searches, the variety of "people also ask" questions, and so on can be good resources to find spin-off topics and sub-topics for a given top-level keyword. You can use Google Trends data for this purpose as well.
When you plug a search phrase into Google Trends, there's more than just that chart of interest. If you scroll down, you'll see a map with geographic interest subdivided by region, like State in the U.S., but what you want is below even that.
At the bottom right of the page, you see a box labeled "Related queries."
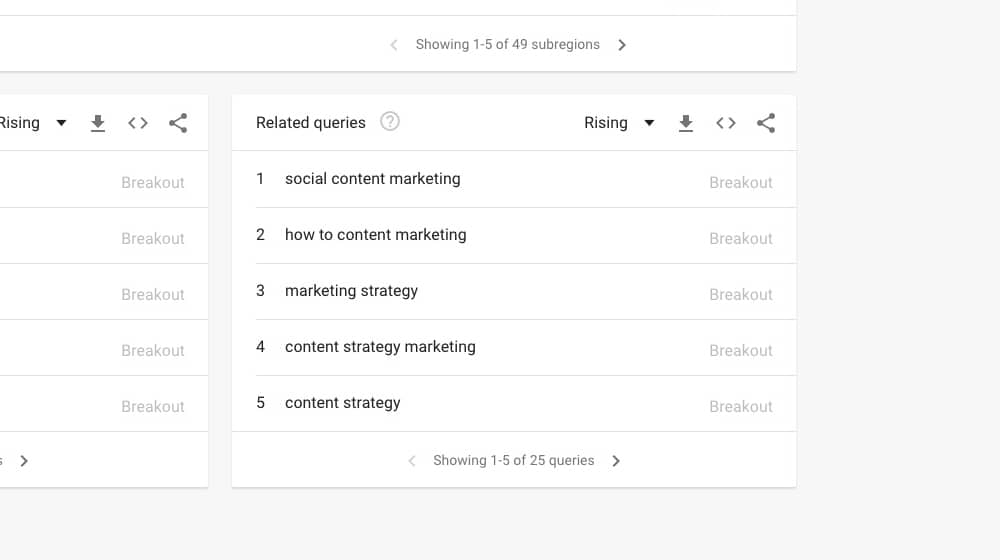
This area is a list of keywords people search for in addition to searching for your primary term. They come in two forms:
- Rising: These are "hot topic" queries with a significant increase in the last timeframe. If there's a label of "breakout" next to them, they've had a substantial increase in traffic, though this is usually due to a baseline interest of 0 beforehand. Google's definition of "breakout" is a 5,000%+ growth, by the way.
- Top: The most popular related search queries. Of course, you can click on any of these queries and see more specific information about them.
This section is useful for keyword research, but it's also helpful to see the current health of any given topic.
How to Estimate Performance by Comparing Keywords
One of the most powerful features of Google Trends is the ability to compare the keyword search volume graphs of two queries.
I like to use this to estimate performance. It would help if you had a good keyword with available traffic information to do this.
Comparing two keywords puts both of them on a graph that is bounded by whichever one has the highest performance. It scales the lower-searched keyword based on its performance compared to the higher-performing query.
For example, compare "content marketing" and "search marketing" here. The peak of interest in search marketing happened in October 2017. That peak of traffic is the high-water mark for both graphs.
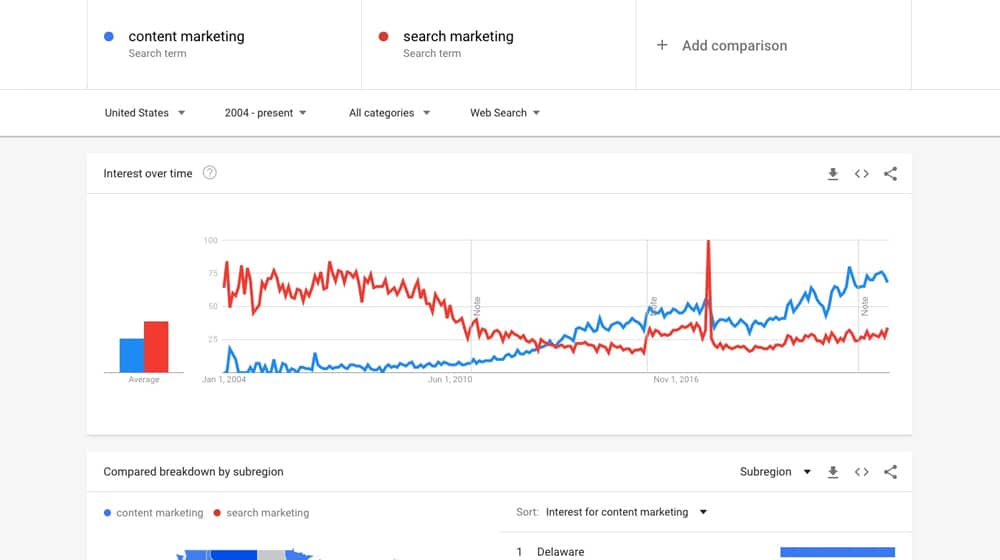
You can see that, before early 2013, "search marketing" was the better keyword. After that point, "content marketing" performs better, barring that unusual spike.
Now, if you know how much traffic you get from a high-performing piece targeting "search marketing", you can guess what kind of traffic you would get from a similar-performing article targeting "content marketing".
If you know specifics about traffic, you can guess what the particulars of traffic for the other might be. You rank #1 for a keyword, and that keyword has 50% of the traffic of another keyword in Google Trends; if you rank #1 for the other keyword, you can expect about double the traffic from that new piece of content.
These are all estimations and rely on many factors, including whether or not you can rank well for the keyword.
If nothing else, though, you can use it to estimate relative search data to help guide your SEO strategy. If you have a keyword you know has X number of searches per month, and you use Trends and find another keyword with a chart that caps out at half that much, you know it's not as high-performing a keyword.
Consider Different Search Types
Google Trends is usually used in its default state, which is web search volume. As web marketers, that's what we're most concerned with.
But Google Search harvests quite a bit more information, and you can also browse different types of searches.
Specifically, you have four other versions:
- Image Search
- News Search
- Google Shopping
- YouTube Search
Each of these has a specific kind of target audience and a specific purpose. A keyword like "content marketing" will have plenty of web search traffic and probably some amount of search volume on YouTube from people who look up video marketers and from Google News for people who are worried about news-related information.
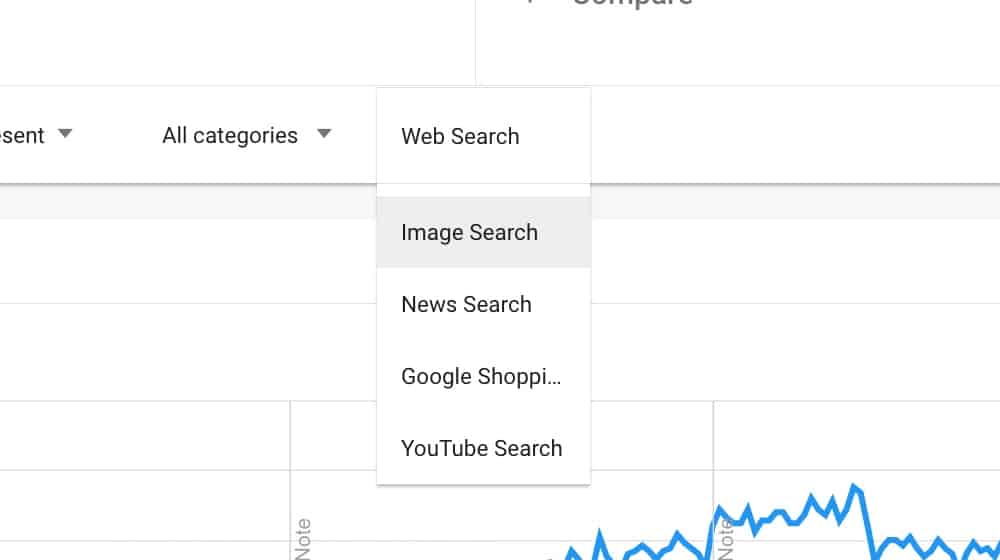
At the same time, only a few people will be using Google Shopping or Google Image Search to look for "content marketing" because it's just not a visual topic.
Conversely, searching for something like the Mona Lisa will have higher Google Image Search traffic, though probably not as much Google Shopping traffic. Searching for Veritasium (a YouTube channel) will have a high volume of YouTube search traffic and probably less image search traffic.
The critical part here is to check keywords for different forms of search. A keyword that might not perform well with a typical blog post might do well with a YouTube video or an image with anchor text and metadata optimization. While YouTube doesn't necessarily convert into website clicks very well, pictures do better than you might think since Google makes it more challenging to get an image directly from their search results.
Check Daily Search Trends
Another valuable opportunity is to check the Daily Trends section of Google Trends.
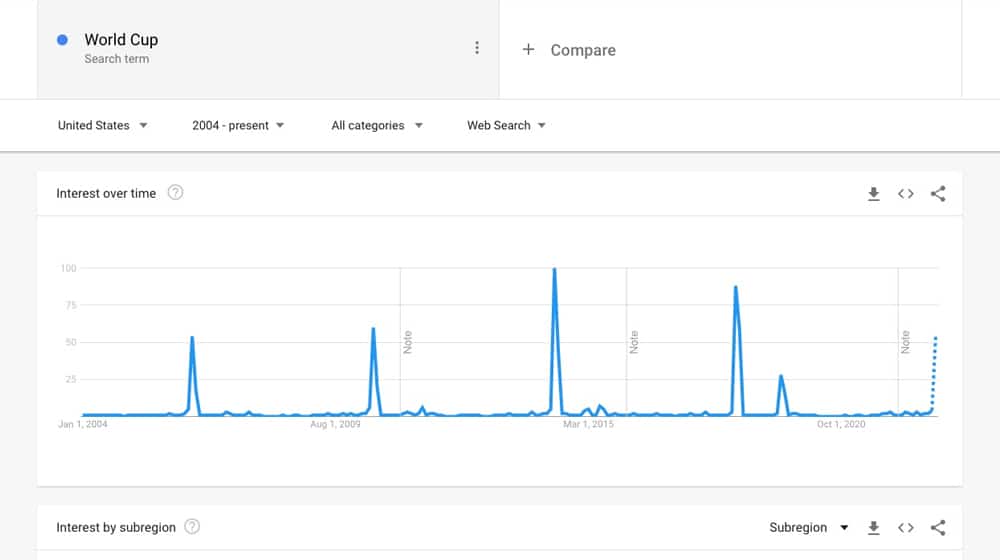
Of course, these aren't necessarily going to be helpful to you. As I'm writing this, we're in the peak sports season, so 90% of the trending topics are sports games of various sorts. When a topic like the World Cup takes over, it's going to take over, you know?
The one nice thing about this is it's one of the few places Google will provide (rough) traffic numbers for search volume. The top five searches for me as I write this have 2M, 500k, 200k, 200k, and 200k estimates.
It could be more precise, but it's better than nothing.
Look for Seasonal Spikes
Seasonality is one of the most critical aspects of evergreen content.
For an easy example, think of "turkey recipes." Looking at the chart for this query, you can see a considerable spike. The trend is about to explode, and if you get in on it now, you'll have a great time.
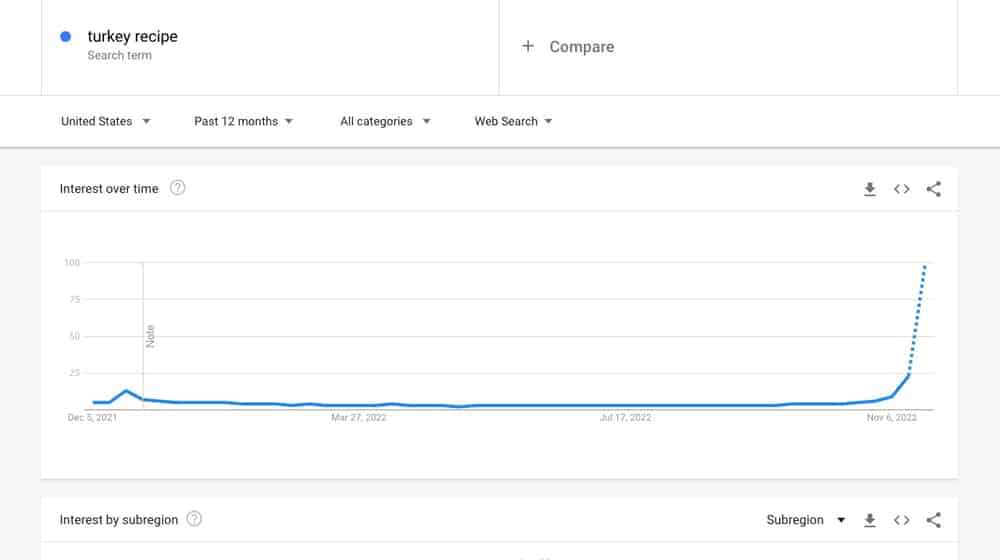
Well, not really. If you expand the chart to previous years, a clear pattern emerges. Every November, like clockwork, a massive spike lasts long enough for everyone to cook their turkey for Thanksgiving before interest drops to nothing until next year.
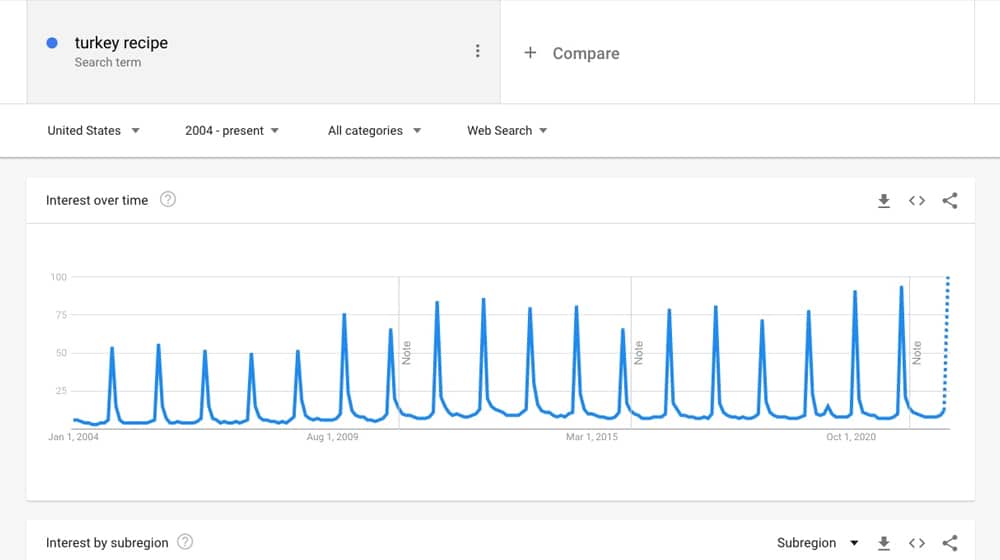
Now, turkey recipes are pretty seasonal. What you should do is test other keywords you have and look for similar patterns. Identifying and capitalizing on a seasonal trend can be a powerful marketing strategy if you can get in on it early and keep up with it.
Don't Forget the Geographic Context
Google Trends allows you to filter their data by geography, broader and narrower than their defaults.
Checking different states, regions, or countries can give you a good idea of where a trend is trending and whether or not you can capitalize on it.
For example, your keyword spikes in Trends, but you don't see an increase in traffic. Why might that be? There may be something wrong with your content; if you fix it, you can capitalize. On the other hand, maybe the spike is coming from Latin America; since you aren't writing in Spanish and you can only ship eCommerce products in your country, it doesn't do you any good to capture that trend.
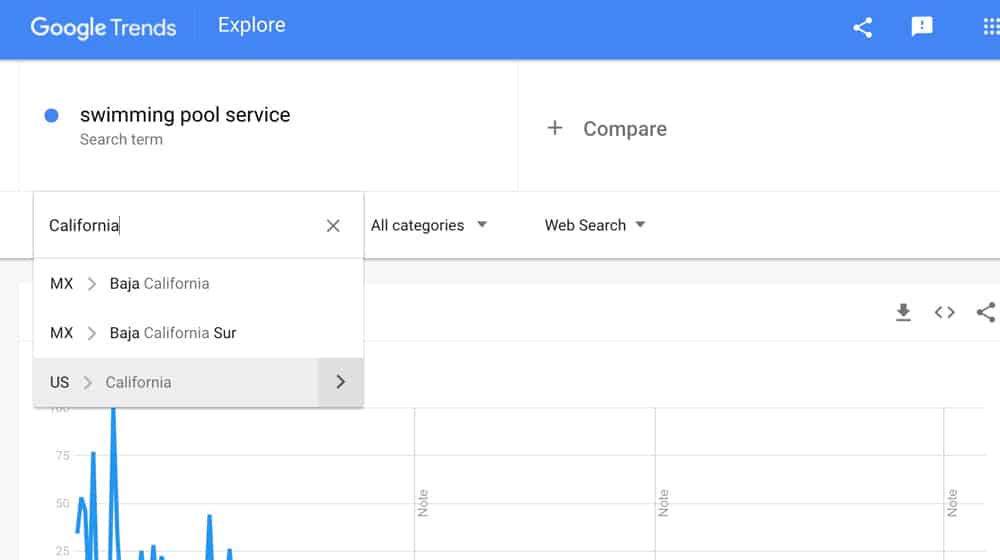
Google Trends is, if nothing else, a powerful tool for adding context to trending keywords. Use it to add geographic context. Use it to add seasonal context. Use it to compare to other specific keywords, to add overall context.
Remember, too, that there's nothing wrong with targeting keywords that aren't trending, those that are trending outside your usual areas, or those with a lower search volume than your typical keywords. If all you ever do is chase the rising trends, you'll lose out on the long-term growth you need to keep a content strategy on track.
Finally, always remember that correlation is not causation. You can draw some conclusions from Google Trends, but be wary of drawing the wrong ones. Just because two graphs are oddly similar doesn't mean the keywords are connected; data harvesting is similar, interest is similar, or even overall global awareness follows similar ebbs and flows.





December 02, 2022
Thank you for your complimentary guide to using Google Trends for keyword research and SEO. I have already used your information to great effect in my business, and I highly recommend it to anyone looking to improve their online visibility.
December 02, 2022
Thanks Martin, glad to hear that you found it useful 🙂